
The US market operates under fundamentally different conditions. It consolidates around a handful of English-language publishers competing for institutional credibility and retail attention simultaneously, while readers split their time between crypto-native specialists and mainstream financial outlets with crypto coverage.
To understand how these publishers actually performed against that competitive landscape, we examined traffic data in Q4 2025 (October-December). The data reveals an ecosystem reorganizing around loyalty, algorithmic discoverability, and the emerging AI discovery layer.
Key takeaways | TL;DR
- Traffic declined 33.47% from October to December, mirroring the broader cooling of speculative interest as Bitcoin peaked and year-end profit-taking dominated market sentiment.
- Direct traffic remained the dominant source at 44.02%, demonstrating that US audiences maintain habitual relationships with trusted publishers even during contracting market conditions.
- AI referrals now constitute 25.61% of all referral traffic, positioning AI-driven discovery as an important visibility channel in the US crypto media ecosystem.
- X dominates social discovery, accounting for 70.87% of social traffic, making platform presence non-negotiable for publishers seeking social-driven discovery.
Methodology: what was measured and why
We analyzed Similarweb traffic data for 130 outlets serving US audiences during Q4 2025 (October-December).
Crypto-native publications: 82
Mainstream/non-crypto portals: 48
Note: External estimates can differ from a publisher's own analytics (e.g., GA4, Adobe, Chartbeat). Reasons include modeled vs. first-party tagging, bot/IVT filtering, cookie consent/ad block, session rules/time zones, AMP/subdomain handling, private-share classification (e.g., WhatsApp often shows as "Direct"), and web vs. app coverage. We keep the methodology consistent across outlets and focus on directional trends. When material gaps appear, we note them qualitatively rather than retrofitting figures to individual dashboards.
The study focuses on crypto-native publications, defined as outlets whose primary editorial mandate centers on digital assets, blockchain technology, and Web3 developments. Mainstream financial media with crypto coverage (Forbes, Bloomberg, CNBC, Reuters) were tracked separately to provide comparative context on traffic source composition and audience behavior.
In addition to Similarweb, Outset PR conducted a short survey and a set of structured conversations with U.S.-based editors and newsroom operators. The goal was to enrich the quantitative read with current operating context and validate our interpretations of channel attribution, discover mechanics, and the emerging AI referral layer. Editor feedback informed the report’s conclusions and remains anonymous by default, except where respondents explicitly approved attribution for on-the-record commentary.
To combine both growth performance and engagement quality fairly, we've applied the Composite Score (CS):
CS = (Normalized Relative Growth × 0.25) + (Normalized Absolute Gain × 0.55) + (Engagement Index (EI) × 0.20)
Outlets with under 10K monthly traffic were excluded to ensure comparability and statistical reliability.
Q4 traffic contracts as year-end profit-taking cools speculative interest
U.S. crypto-native media saw total visits drop 28.24% to 106.18M in Q4 2025, down from 147.96M in Q3. This contraction hit 71.95% of outlets, leaving only 28.05% with positive growth. While the average publisher declined by 14.78%, a fifth of the industry lost over one-third of their traffic, and several plummeted by more than two-thirds.

Success throughout this period hinged entirely on the structural integrity of the audience base. Publishers prioritizing deep, direct relationships with their readers maintained a steady core despite the broader market cooling. These outliers leveraged high-conviction content that compelled readers to seek the source directly, effectively insulating them from broader trends.
Conversely, outlets relying on the volatility of social media amplification and search engine algorithms found their traffic was merely a temporary loan. As speculative fervor faded, these discovery-dependent models lacked the brand equity to retain readers, leading to a rapid evaporation of interest that began in the quarter's opening month.
October initially masked these structural weaknesses by delivering 43.92M visits, the quarter's peak, fueled by Bitcoin surging past $126,000. Price movement acted as the primary catalyst for attention, but the subsequent volatility transformed simple curiosity into a desperate search for forensic analysis.

When Bitcoin retreated sharply from its high, the narrative shifted from celebration to a deep inquiry into whether the established four-year market cycle had reached a terminal point. This demand for clarity reached a fever pitch on October 10, following a $600 billion wipeout triggered by a massive liquidation event. Uncertainty served as a temporary magnet, drawing a broad spectrum of participants into the ecosystem to determine if the bull market remained intact or had fundamentally broken.
November signaled a transition from this panicked inquiry to total capitulation. As Bitcoin plummeted another 27.07% to settle below $81,000, traffic followed the downward trajectory, falling 24.79% to 33.04M visits. The psychological floor broke alongside the price, and readers who had sought answers in October now faced a market that appeared irreparable.
Macroeconomic headwinds compounded this exhaustion. Federal Reserve resistance to rate cuts stripped away the liquidity thesis that had fueled the year’s optimism, while a government shutdown paralyzed the flow of economic data. In this vacuum of information and capital, the divide between publishers widened, as those without direct reader loyalty saw their relevance vanish alongside the exit of the casual observer.
December finished the quarter with a period of total abandonment. Traffic dwindled a further 11.54% to 29.22M visits as Bitcoin entered a stagnant, sideways range that offered neither the drama of a crash nor the excitement of a recovery.
The temporary nature of the government's funding extension and ongoing divisions at the Fed left the outlook for 2026 entirely opaque, discouraging any new positions or engagement. Without a clear catalyst for growth or a dramatic failure to analyze, the motive for media consumption disappeared. Crypto media requires either price movement or structural meaning to sustain attention. December provided neither, confirming that when confidence is broken and volatility dies, the audience simply stops looking.
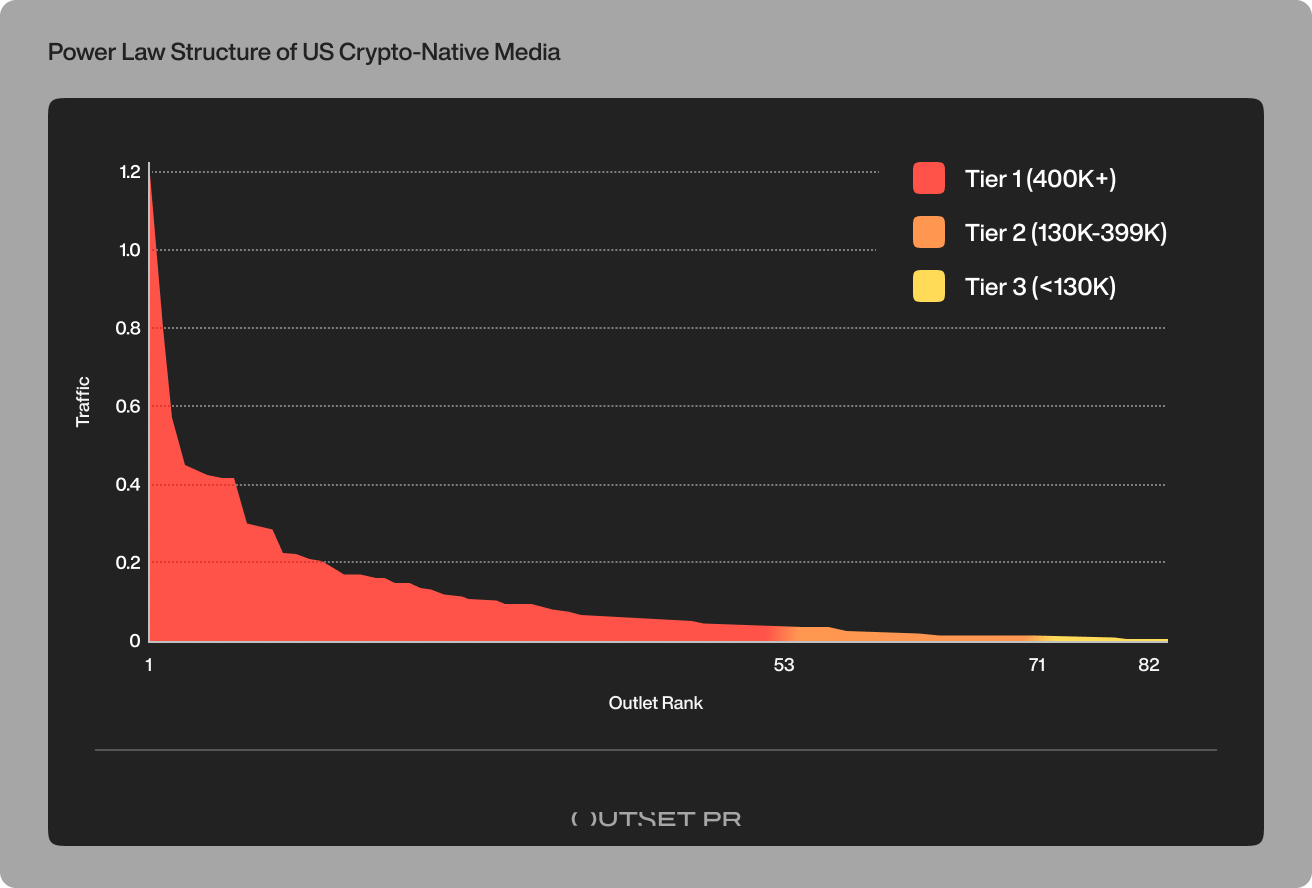
U.S. crypto-native media reaches oligopoly status as tier-1 cohort absorbs 95.25% of demand
We categorized 82 U.S crypto-native outlets into three distinct tiers based on traffic volume. According to our Tier system, the distribution of attention adheres to a strict Power Law, specifically a Zipfian distribution, where a small vanguard of incumbents captures nearly the entire surface area of the ecosystem, leaving the long tail to fight over statistical scraps.
The mechanism driving this is the compounding nature of algorithmic authority. Search engines and social feeds are preferentially attached to historical volume, creating a feedback loop where reach begets reach. The result is a market structure that punishes mediocrity with invisibility.
We quantified this inequality using the Gini Coefficient, a standard economic metric for wealth distribution. The U.S. crypto media sector registers a Gini Coefficient of 0.62.
For context, a Gini of 0.62 places this digital ecosystem in the same tier of wealth inequality as the economies of South Africa or Namibia. It is significantly more stratified than the U.S. household income distribution (0.48). In this environment, "competition" is a misnomer. The market effectively functions as an oligopoly where the barrier to entry is not capital, but the insurmountable inertia of established attention.
Tier 1 (400K+ monthly visits)
Composition: 53 outlets
Market share: 95.25% of total traffic
Notable publishers include:
- coindesk.com (total Q4 traffic is 13.11M)
- cointelegraph.com (total Q4 traffic is 8.50M)
- beincrypto.com (total Q4 traffic is 5.72M)
- cryptonews.com (total Q4 traffic is 4.53M)
- newsbtc.com (total Q4 traffic is 4.42M)
This tier does not just lead the market because it is the market. With over 101 million combined visits, these 53 publishers constitute the "Too Big to Fail" layer of the industry. They benefit from what we might call a "wide moat," as their domain authority is so entrenched that they rank for high-value keywords by default. For a PR strategist or founder, coverage here is the only metric that moves the needle on broad retail awareness.
Tier 2 (130K-399K monthly visits)
Composition: 18 outlets
Market share: 3.81% of total traffic
Notable publishers include:
- protos.com (total Q4 traffic is 399.35K)
- dailycoin.com (total Q4 traffic is 376.44K)
- thecoinrepublic.com (total Q4 traffic is 354.87K)
- ledgerinsights.com (total Q4 traffic is 298.29M)
- livebitcoinnews.com (total Q4 traffic is 264.30K)
This is the most precarious position in the ecosystem. Tier-2 outlets carry the operational overhead of a tier-1 publication (editorial staff, technical costs) but lack the algorithmic favor to monetize it efficiently. They are caught in a "middle-income trap," too large to be a nimble blog but too small to compete for the primary advertising dollars.
This segmentation reveals that the "middle class" of crypto media has largely evaporated, leaving a binary outcome: you are either a platform of record, or you are a niche outlier.
Tier 3 (<130K monthly visits)
Composition: 11 outlets
Market share: 0.94% of total traffic
Notable publishers include:
- en.bitcoinsistemi.com (total Q4 traffic is 127.03K)
- blockster.com (total Q4 traffic is 124.98K)
- theholycoins.com (total Q4 traffic is 119.21K)
- droomdroom.com (total Q4 traffic is 106.92M)
- tronweekly.com (total Q4 traffic is 102.26K)
While statistically insignificant in terms of volume, the "Tail" is not without value. The survival of these outlets suggests they are not competing on breadth but on specific, hyper-local, or technical vertical depth. However, the math is unforgiving here. In a power-law environment, the cost of customer acquisition for tier 3 is exponentially higher than for tier 1. These outlets exist in a state of permanent resource starvation, reliant entirely on the loyalty of a small, distinct audience rather than the flow of the broader market.
Mainstream crypto coverage consolidates around 10 outlets capturing 86.05% of traffic
Across 48 mainstream financial outlets analyzed in Q4 2025, the competitive landscape mirrors that of crypto-native media, characterized by a power law distribution.
Tier-1 outlets alone capture 97.68% of all traffic, which is an even more extreme concentration than crypto-native media's 95.25%. The top five outlets (USA Today, CNBC, Forbes, Reuters, and Wall Street Journal) account for the vast majority of this attention, with the top 10 commanding 86.05% of all mainstream financial media traffic.
- usatoday.com (total Q4 traffic is 422.60M)
- cnbc.com (total Q4 traffic is 318.83M)
- forbes.com (total Q4 traffic is 248.15M)
- reuters.com (total Q4 traffic is 232.37M)
- wsj.com (total Q4 traffic is 228.15M)
- bloomberg.com (total Q4 traffic is 130.46M)
- marketwatch.com (total Q4 traffic is 107.65M)
- fortune.com (total Q4 traffic is 104.81M)
- thestreet.com (total Q4 traffic is 86.68M)
- zerohedge.com (total Q4 traffic is 66.47M)
This represents a deeper oligopoly than crypto-native publishing, where scale disparities stem from domain authority and institutional trust rather than algorithmic discovery velocity.
The tier breakdown itself reveals a market bifurcated by capital and institutional legacy. Tier-1 outlets (above 10M monthly visits) consist of established, diversified media conglomerates that treat crypto as a fractional editorial vertical within sprawling financial news operations. These outlets benefit from decades of institutional trust, regulatory relationships, and advertising integration that startups cannot replicate.
Tier-2 outlets (1M-10M visits) include specialized financial outlets positioned between mass-market news and niche-vertical coverage. They occupy the lucrative mid-market, serving active traders and investment-focused audiences.
Tier-3 outlets (below 1M visits) operate as micro-scale verticals with minimal financial infrastructure, reliant on content syndication and affiliate revenues.
Top 10 crypto-native publishers in the US in Q4 2025 ranked by CS
1. U.Today – The breakout growth champion
Main audience: US
Q4 growth: 66.27%
CS score: 0.58
Visit duration: 0.43 min
Pages/visit: 1.96
Bounce rate: 46.47%
Direct traffic: 51.79%
Organic traffic: 16.20%
Social traffic: 7.61%
Social mix: X (88.92%), YouTube (11.08%)
AI referrer (of referral): 4.29%
U.Today tops the CS rankings through exceptional growth momentum. The 66.27% quarterly expansion reflects aggressive content velocity paired with effective social amplification, particularly on X, where the outlet's breaking-news orientation resonates powerfully with trading-focused audiences.
Strengths:
- Social distribution excellence. Dominant direct traffic share (51.79%) indicates successful conversion of social discovery into habitual readership patterns.
- Ecosystem integration. Referral traffic shows concentration through crypto aggregators and trading platforms (CoinMarketCap, TradingView), positioning U.Today within the ecosystem's information infrastructure rather than competing solely for organic search.
Vulnerabilities:
- Shallow engagement. 26-second sessions and 1.96 pages/visit mean users leave almost immediately.
- X dependency. 88.92% of all social media traffic is sourced from X. A change in X's algorithm could cause nearly 6.77% of an outlet's total traffic to collapse.
- Organic traffic collapse. Organic traffic stands at 16.20%, the lowest share among the top 10, signaling weak standalone demand and heavy reliance on external discovery channels. If social discovery weakens, overall visibility and user acquisition would likely deteriorate rapidly, exposing the fragility of the growth model.
U.Today demonstrates that a velocity-first editorial strategy can generate explosive growth when paired with effective social distribution. However, the critical question for 2026 remains whether this momentum converts into sustainable audience loyalty or represents a sentiment-driven spike vulnerable to market cooling.
The outlet's model rewards breaking news and rapid market commentary. PR campaigns targeting this outlet should emphasize timeliness, trading relevance, and social-shareable angles suited to X-native audiences. Expect rapid publication cycles and high receptivity to viral, sentiment-driven narratives.
2. CryptoDaily – The engagement depth leader
Main audience: US/UK
Q4 growth: 13.86%
CS score: 0.56
Visit duration: 0.09 min
Pages/visit: 10.3
Bounce rate: 42.84%
Direct traffic: 43.34%
Organic traffic: 43.61%
Social traffic: 3.49%
Social mix: X (61.44%), Unidentified (38.56%)
AI referrer (of referral): 32.26%
CryptoDaily achieves the second-highest CS ranking through a radically different business model from U.Today: exceptional engagement depth that compensates for modest absolute scale. Its 10.3 pages-per-visit figure represents the highest reading depth in the entire dataset by a substantial margin, indicating content architecture deliberately engineered to encourage systematic exploration rather than single-article consumption.
Strengths:
- AI optimization pioneer. 32.26% AI referrer rate positions CryptoDaily as a primary beneficiary of AI-driven discovery, likely through structured data presentation and topic organization that AI systems can parse and cite effectively
- Channel diversification. Balanced direct (43.34%) and organic (43.61%) traffic suggests reduced channel dependency and more resilient audience acquisition
- Decision-support positioning. Engagement profile suggests a dedicated readership whose research depth exceeds casual news consumption, serving users making investment decisions rather than merely tracking headlines
- Specialized content architecture. Multi-page session patterns indicate clear taxonomy and content linking that reward systematic exploration
Vulnerabilities:
- Infinite scroll metric inflation. Although the outlet reports 10.3 pages per visit, that figure is likely an artifact of its infinite scroll design. As users scroll, dozens of articles are auto-loaded and potentially counted as separate pageviews, even when they receive only a fraction of a second of attention. This mechanically inflates engagement metrics, creating the appearance of exceptional depth that is not supported by the underlying 5-second average session duration.
CryptoDaily proves that engagement quality can generate competitive CS scores without massive scale. Its model suggests that specialization and editorial depth may become increasingly viable competitive strategies as the market matures beyond speculation.
Plus, the audience on CryptoDaily expects comprehensive, interconnected analysis. So, PR outreach should provide context-rich angles, data-supported claims, and story frameworks suited to deep dives. This outlet rewards substantive narratives over breaking news.
3. DigitalCoinPrice – The data utility optimizer
Main audience: US/UK/India
Q4 growth: 40.06%
CS score: 0.54
Visit duration: 0.19 min
Pages/visit: 1.85
Bounce rate: 43.06%
Direct traffic: 53.55%
Organic traffic: 38.75%
Social traffic: 2.25%
Social mix: Unidentified
AI referrer (of referral): 11.50%
DigitalCoinPrice combines strong growth with effective audience retention through its utility-centric value proposition. Price predictions, historical charts, and comparative analysis tools create use-case-driven traffic that returns for recurring reference rather than single-use consumption, which is a fundamentally different traffic psychology from news-driven outlets.
Strengths:
- Recurring usage patterns. Strong direct traffic (53.55%) reflects users bookmarking the platform as a permanent research resource
- Reference utility. Low bounce rate (43.06%) and multi-page sessions (1.85 pages/visit) indicate visitors systematically checking multiple assets or features during sessions
- Data-driven growth. Traffic expansion stems from genuine utility value rather than sensationalism or social amplification
Vulnerabilities:
- AI optimization opportunity. Modest AI referrer percentage (11.50%) suggests untapped potential, as structured price data would theoretically suit AI citation patterns ideally
- Social irrelevance. The low social traffic, at only 2.25%, suggests that the content is not effectively encouraging users to share it.
DigitalCoinPrice illustrates how utility-focused content generates both growth and retention superior to news-driven competitors. Data products create habitual usage patterns that temporal news content struggles to match.
It serves both investors and traders requiring ongoing data reference. PR strategy should emphasize lasting product updates, fundamental analysis, and asset comparison angles rather than time-sensitive announcements.
4. CryptoNinjas – The referral network specialist
Main audience: US/Indonesia
Q4 growth: 33.67%
CS score: 0.533
Visit duration: 0.49 min
Pages/visit: 2.06
Bounce rate: 41.14%
Direct traffic: 33.64%
Organic traffic: 53.25%
Social traffic: 2.89%
Social mix: X (39.66%), Unidentified (20.98%), 4chan (16.71%), YouTube (14.44%), LinkedIn (8.2%)
AI referrer (of referral): 89.10%
CryptoNinjas achieves its CS ranking through extreme AI referral optimization, as 89.10% of its referral traffic flows through AI-driven discovery channels, the highest concentration in the top 10 by a significant margin and top three in the entire dataset. This positioning reflects deliberate content structuring for machine comprehension, with clear entity identification, structured data presentation, and AI-friendly content formatting.
Strengths:
- AI-first architecture. Highest AI optimization in the dataset suggests an early competitive advantage as algorithmic discovery scales as the primary traffic driver
- Dual-channel foundation. Strong organic traffic (53.25%) provides the foundation upon which AI referrals compound, rather than representing AI-dependent fragility
- Cross-market scaling. US/Indonesia audience split demonstrates successful content resonating across different crypto ecosystem maturity levels
- Solid engagement retention. 2.06 pages per visit and 41.14% bounce rate indicate readers find value despite brief session duration
Vulnerabilities:
- Extreme AI dependency. AI sources drive 89.10% of referral traffic, creating a single point of failure. One meaningful algorithm adjustment could erase roughly 9% of total traffic overnight.
- Shallow engagement. Average sessions last 29 seconds, indicating intent-driven visits rather than loyal readership. AI referrals deliver answers, not audiences, limiting repeat visits, brand attachment, and long-term monetization potential.
CryptoNinjas represents one of the most aggressive AI-optimization strategies in the dataset. Its success suggests that early movers in AI discoverability may capture durable positioning as this channel matures from experimental to primary traffic source.
The outlet’s success with AI discovery positions it ideally for campaigns leveraging algorithmic search. PR narratives should emphasize clear entity relationships, foundational technology explanations, and structured information suitable for AI parsing and citation.
5. ZyCrypto – The balanced growth achiever
Main audience: US/UK
Q4 growth: 38.37%
CS score: 0.529
Visit duration: 0.27 min
Pages/visit: 2.06
Bounce rate: 47.95%
Direct traffic: 42.39%
Organic traffic: 28.54%
Social traffic: 4.23%
Social mix: X (32.36%), Unidentified (30.61%), LinkedIn (30.35%), Reddit (4.55%), YouTube (2.14%)
AI referrer (of referral): 0.78%
ZyCrypto achieves a solid CS ranking through balanced traffic acquisition and consistent growth. Its 38.37% quarterly expansion demonstrates editorial momentum without reliance on any single discovery channel, with traffic distributed across direct (42.39%), organic (28.54%), referral (24.48%), and social (4.23%) sources.
Strengths:
- Channel resilience. Diversified traffic acquisition across four major sources suggests reduced vulnerability to single-channel algorithm changes
- Consistent execution. Solid growth without breakthrough performance in any dimension reflects reliable editorial execution
- General-market positioning. Serves broad crypto news audiences without niche specialization, capturing a wider addressable market than specialist competitors
Vulnerabilities:
- AI optimization lagging. Minimal AI referrer percentage (0.78%) represents a significant gap versus peers, suggesting an untapped compound growth opportunity
ZyCrypto demonstrates that consistent execution across multiple channels can generate competitive growth without requiring breakthrough positioning in any single dimension. However, failure to optimize for emerging AI discovery may constrain future growth against competitors.
It offers reliable, balanced coverage of crypto news. PR strategy should emphasize broad market relevance and multi-channel distribution potential rather than niche specialization or single-channel optimization.
6. TimesTableoid – The social amplification model
Main audience: US/UK
Q4 growth: 44.11%
CS score: 0.528
Visit duration: 1.19 min
Pages/visit: 1.46
Bounce rate: 55.52%
Direct traffic: 40.49%
Organic traffic: 13.68%
Social traffic: 13.95%
Social mix: X (69.3%), Reddit (17.98%), YouTube (11.93%), Facebook (0.79%)
AI referrer (of referral): 0.06%
TimesTableoid achieved exceptional growth (44.11%) through social distribution strength, with 13.95% of traffic arriving via social platforms, the highest social share in the CS top 10. The social-first strategy generates growth momentum when content resonates with sharing behavior on X and related platforms.
Strengths:
- Deep content engagement. Notably strong session duration (1.19 min) indicates content depth that rewards extended individual-article engagement
- Effective social amplification. The highest social traffic percentage in the cohort demonstrates successful X-native audience building
- Strong growth trajectory. 44.11% quarterly expansion ranks among the highest performers
Vulnerabilities:
- Organic channel weakness. Low organic traffic (13.68%) indicates limited search discovery appeal
- Minimal AI positioning. Near-zero AI referrer activity (0.06%) represents the largest competitive gap in the dataset
- Social dependency fragility. Growth depends heavily on social amplification cycles that may prove difficult to sustain during market contractions when sharing behavior decreases
TimesTableoid illustrates both the power and fragility of social-dependent growth models. Q4's strong performance may face headwinds if social engagement contracts alongside broader crypto market sentiment cooling.
Its social-first strategy makes it ideal for campaigns targeting X-native audiences and driving social virality. However, performance is highly cyclical. One should expect strong results during bull sentiment and material deterioration during bear markets when social engagement contracts.
7. AltcoinBuzz – The altcoin community anchor
Main audience: US
Q4 growth: 30.78%
CS score: 0.523
Visit duration: 0.18 min
Pages/visit: 1.8
Bounce rate: 43.16%
Direct traffic: 40.94%
Organic traffic: 46%
Social traffic: 2.28%
Social mix: Unidentified (68.76%), Facebook (22.84%), LinkedIn (8.4%)
AI referrer (of referral): 74.82%
AltcoinBuzz combines specialized altcoin coverage with strong AI discoverability (74.82% of referral traffic via AI channels). This positioning serves audiences researching specific tokens and projects-queries where AI tools increasingly intermediate between user intent and publisher content, positioning AltcoinBuzz in the emerging AI-to-crypto information infrastructure pipeline.
Strengths:
- Niche specialization. Focused altcoin coverage creates deep topical authority for specific audience segments. At the same time, category breadth expands reach far beyond a narrow readership due to the scale of the altcoin ecosystem.
- AI-native alignment. A high AI referrer percentage suggests that content structure and entity relationships naturally suit algorithmic discovery
- Balanced foundation. A combination of direct (40.94%) and organic (46%) traffic provides stability beneath the AI-referral growth layer
- Intent matching. Low bounce rate (43.16%) and solid pages-per-visit (1.8) indicate content that matches reader search intent effectively
Vulnerabilities:
- AI concentration risk. Automated systems generate 74.82% of referral traffic, creating a clear single point of failure. A single adverse algorithm change could eliminate roughly 7% of total traffic in a short time span.
AltcoinBuzz demonstrates how niche positioning can generate competitive CS scores through focused expertise rather than broad reach. Altcoin project announcements and token-specific analysis find ideal audiences here.
It serves dedicated token researchers and altcoin traders. PR campaigns should target project-specific news, technical updates, and comparative token analysis suited to specialist audiences.
8. CoinCu – The engagement depth challenger
Main audience: US/India/Ukraine
Q4 growth: 12.79%
CS score: 0.52
Visit duration: 4.24 min
Pages/visit: 4.06
Bounce rate: 48.16%
Direct traffic: 31.38%
Organic traffic: 19.45%
Social traffic: 40.32%
Social mix: X (99.93%), YouTube (0.07%)
AI referrer (of referral): 2.72%
CoinCu achieves its CS ranking through exceptional engagement depth rather than explosive growth. Its 4.06 pages-per-visit and 264-second session duration represent the second-highest engagement metrics in the entire dataset, indicating content architecture deliberately engineered to reward systematic exploration.
Strengths:
- Social-to-engagement conversion. Unusually high social traffic (40.32%) combined with the highest-class engagement suggests successful conversion of social audiences into deep readers, which is a rare combination
- Global market coverage. Tri-market audience (US/India/Ukraine) reflects global English-language positioning, capturing readers across multiple time zones and crypto ecosystem maturity levels
- Structural content design. Engagement metrics suggest deliberate content taxonomy encouraging cross-article exploration
Vulnerabilities:
- Modest expansion. 12.79% Q4 growth ranks second lowest among the top 10, suggesting an established audience base with limited viral appeal
- X concentration risk. 40.29% of total traffic originates from X, creating outsized exposure to platform-level events. An algorithm shift or an accidental account ban could result in a sudden and severe traffic contraction.
CoinCu demonstrates that social acquisition can feed quality engagement when content depth rewards extended exploration. The model suggests social-acquired audiences can be converted into engaged readers through superior information architecture.
Its strength lies in converting social traffic into deep engagement. PR narratives should provide comprehensive, interconnected angles suited to extended reading and systematic exploration of related topics.
9. DrooomDroom – The emerging market crossover
Main audience: US/India
Q4 growth: 17.09%
CS score: 0.51
Visit duration: 0.19 min
Pages/visit: 1.85
Bounce rate: 40.06%
Direct traffic: 36.10%
Organic traffic: 45.94%
Social traffic: 5.61%
Social mix: Unidentified (63.24%), LinkedIn (36.76%)
AI referrer (of referral): 89.26%
DrooomDroom combines modest scale with aggressive AI optimization, achieving the highest AI referrer concentration in the dataset at 89.26% of referral traffic. This extreme AI positioning, combined with a low bounce rate (40.06%) and respectable growth (17.09%), suggests effective alignment between AI-surfaced content and reader intent.
Strengths:
- Peak AI optimization. 89.26% AI referrer rate represents the highest concentration in the top 10, suggesting maximum structural alignment with algorithmic discovery
- Cross-market appeal. US/India audience split reflects successful positioning serving both mature Western and emerging market audiences
- Strong intent matching. Low bounce rate (40.06%) suggests AI is routing qualified traffic effectively to matching content
Vulnerabilities:
- Limited audience. With an average of ~35K Q4 visits, DroomDroom is micro-scale. Even with “good” engagement, there just isn’t enough volume to support meaningful ad, sponsorship, or token revenue.
- AI exposure risk. AI accounts for roughly 10.22% of total traffic, creating a dependency on opaque ranking mechanisms. Even a modest algorithm adjustment could materially reduce overall visibility and inbound flow.
DrooomDroom's extreme AI optimization, combined with an emerging market focus, suggests early leadership in algorithmic discovery positioning. As AI discovery scales globally, this outlet may experience accelerated growth if maintaining content-algorithm alignment.
Its highest-in-dataset AI optimization makes it ideal for campaigns leveraging algorithmic discovery, particularly announcements with clear emerging market relevance. Content should emphasize structured information and cross-market appeal.
10. Bankless – The platform specialist
Main audience: US
Q4 growth: 0.57%
CS score: 0.50
Visit duration: 1.28 min
Pages/visit: 4.08
Bounce rate: 38.32%
Direct traffic: 57.76%
Organic traffic: 24.83%
Social traffic: 9.69%
Social mix: X (69.01%), YouTube (26.27%), Discord (4.71%)
AI referrer (of referral): 28.78%
Bankless rounds out the CS top 10 through distinctive platform and community-infrastructure positioning that generates competitive scores despite flat growth. Its 4.08 pages-per-visit and 77-second session duration rank among the dataset's engagement leaders, reflecting a dedicated readership that treats Bankless as a learning platform rather than a news source. The 57.76% direct traffic share, the highest in the cohort, signals strong brand loyalty and habitual usage patterns characteristic of educational resource hubs rather than breaking-news outlets.
Strengths:
- Community-infrastructure model. Direct traffic dominance (57.76%) combined with Discord presence (4.71% of social) indicates successful conversion of readers into community members, creating retention mechanics beyond content alone
- Engagement depth leadership. Multi-page sessions (4.08) and extended time-on-site (1.28 min) demonstrate content designed for learning and skill-building rather than headline consumption
- Platform diversification. Balanced social presence across X (69.01%), YouTube (26.27%), and Discord (4.71%) reflects a multi-format content strategy suited to different learning modalities
- Lowest bounce rate in cohort. 38.32% bounce rate indicates superior content-intent matching and effective onboarding flows that retain first-time visitors
Vulnerabilities:
- Growth stagnation. 0.57% Q4 expansion represents near-zero momentum, suggesting the outlet has saturated its core audience or failed to acquire new readers
- Community dependency. High direct traffic reflects a loyal base but also suggests limited new audience acquisition, as growth requires converting casual visitors into community members, a higher-friction path than viral news distribution
Bankless demonstrates that depth-first editorial strategies can generate competitive CS scores through engagement quality even when growth has plateaued. However, the model's 2026 challenge centers on whether educational positioning can scale beyond core DeFi enthusiasts or remains structurally capped at a smaller, highly-engaged niche. The near-zero growth rate suggests the latter. Bankless may have already captured its natural audience ceiling, leaving limited expansion runway without strategic repositioning.
The outlet's platform-learning model rewards comprehensive, evergreen content over breaking news. PR campaigns should emphasize educational angles, protocol deep-dives, and DeFi skill-building narratives suited to committed learners rather than traders seeking alpha. Bankless audiences expect substance and technical depth, and surface-level announcements will underperform.

What the CS rankings reveal
Growth and scale have decoupled
The most interesting finding is the complete absence of traditional tier-1 traffic leaders (CoinDesk, Cointelegraph, BeInCrypto) from the CS top 10. This decoupling reflects a market where:
- Established brands struggle with base-effect constraints: Large audiences are mathematically difficult to grow percentagewise, even with strong editorial execution
- Challengers absorb emerging audience segments: Smaller, focused outlets capture readers seeking specialized coverage, AI optimization, or emergent distribution channels
- Growth velocity increasingly signals market relevance: The market rewards momentum and editorial dynamism as much as accumulated audience size
Three distinct competitive models are emerging
The top 10 diverges into three strategic archetypes:
- Model A – Growth amplifiers (U.Today, TimesTableoid, ZyCrypto). Leverage velocity, social distribution, and immediate market response to drive quarterly growth surpassing 30%. Rely on breaking news and social resonance with trading communities. Vulnerable to market sentiment cooling, but capable of capturing rapid audience expansion during bull markets.
- Model B – Engagement specialists (CryptoDaily, CoinCu, AltcoinBuzz). Prioritize reader depth, engagement duration, and topic specialization over raw scale. Generate competitive CS through superior pages-per-visit metrics (4+ pages) and intent-aligned audiences. More sustainable but limited addressable market compared to broad news outlets.
- Model C – Optimization leaders (CryptoNinjas, DrooomDroom). Capture competitive positioning through AI discoverability optimization (85%+ AI referrer concentration), positioning content for algorithmic discovery infrastructure. Early movers in this emergent category are positioned to achieve a durable competitive advantage as AI increasingly becomes the primary mechanism for content discovery.
X dominates social discovery at 70.87%
Social traffic composition revealed extreme platform concentration with distinct functional roles across the ecosystem.
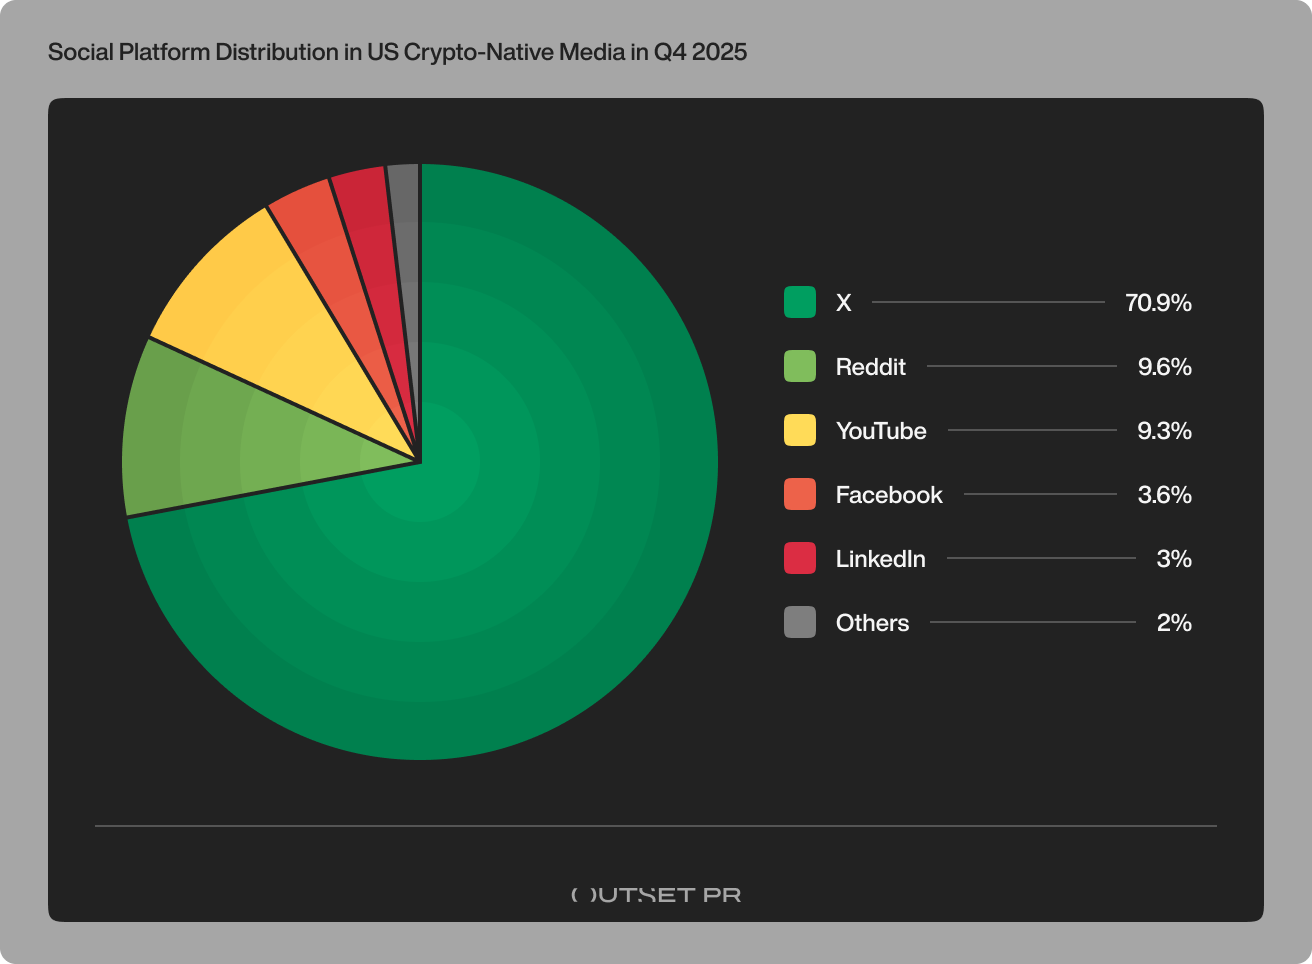
X captured 70.87% of all social traffic (6.24M visits), cementing its position as crypto's primary real-time conversation layer. Breaking news, market commentary, and project announcements continue to flow through X before propagating to other platforms.
The X dominance creates both opportunity and vulnerability for publishers. Strong X presence generates immediate visibility during market events, but algorithm changes, account bans, or platform instability can devastate traffic overnight. Publishers with X-dependent models face binary outcomes: exceptional reach when content resonates or near-invisibility when it doesn't.
Reddit emerged as the secondary social force at 9.55% (840.80K visits), serving a distinctly different function than X. Where X rewards velocity and hot takes, Reddit hosts longer-form discussion and community deliberation that favors explanatory journalism and investigative content. The platform's upvote mechanics surface quality over recency, creating sustained traffic for content that earns community approval.
Reddit's role extends beyond traffic generation to credibility validation. Content that performs well on crypto subreddits gains amplification across other channels as community endorsement signals quality. Publishers tracking Reddit performance gain early indicators of content resonance that predict broader distribution.
YouTube contributed 9.33% (820.70K visits), driven primarily by data-visualization content, market analysis videos, and educational explainers. The platform's long-form nature attracts audiences seeking depth rather than headlines, creating engagement patterns that differ substantially from text-based media. Session duration for YouTube-referred traffic typically exceeds other social sources, indicating higher-intent audiences.
Overall, any strategy aiming for speed and visibility is effectively forced to operate on X. But a strategy built only around X hands distribution power to a single, opaque algorithm that can erase a large portion of traffic overnight. Therefore, additionally using Reddit and YouTube is quite important because they are where trust and depth accumulate. These platforms build the very audiences that become subscribers, customers, or long-term readers.
AI referrers surge to 25.61% of referral traffic, establishing machine discovery as a competitive battleground
The most significant structural shift in the U.S. crypto-native media discovery involves AI-driven traffic, which now constitutes 25.61% of all referral visits on average across tracked outlets.

Top AI referrer sources include ChatGPT (chatgpt.com), Perplexity (perplexity.ai), Google's AI Overviews, and various AI-powered research tools. These platforms increasingly serve as intermediaries between user queries and publisher content, surfacing citations in response to crypto-related questions.
The distribution shows bimodality: only 26 outlets cluster below 20% AI referrer share, while the majority is above 30-40%. This pattern suggests AI optimization operates as a threshold phenomenon where deliberate investment generates substantial returns while passive approaches yield minimal benefit.
Outlets with the highest AI referral concentration share common characteristics:
- Structured data presentation enables AI systems to extract and cite specific facts rather than general narratives. Price data, protocol specifications, and comparative analyses prove more AI-friendly than opinion pieces or news commentary.
- Clear entity identification helps AI systems understand content relationships. Articles explicitly naming projects, people, and concepts in machine-readable formats receive preferential citation.
- Authoritative topical positioning matters because AI systems weigh source credibility when selecting citations. Outlets with established expertise in specific domains earn citation preference within those verticals.
- Machine-readable formatting accelerates AI parsing. Clean HTML structure, consistent heading hierarchies, and explicit metadata enable faster and more accurate content extraction.
CryptoNinjas (89.10% AI referrers) and DrooomDroom (89.26%) demonstrate extreme optimization outcomes, while NewsBTC (0.44%) and TimesTableoid (0.06%) illustrate the opportunity cost of neglecting AI discovery. The gap between leaders and laggards will likely compound as AI tools capture a growing share of information-seeking behavior.
The implications for publishers are that AI summarization threatens to reduce click-through by providing answers directly within AI interfaces. Yet AI citation also surfaces content to audiences who might never have discovered it through traditional search. Publishers must balance content structure for AI comprehension with engagement hooks that motivate click-through from AI-generated responses.
How mainstream outlets compare
The traffic source composition for mainstream outlets is mostly similar to that of crypto-native outlets, except for overall referrals and AI referrals.
Mainstream outlets generate just 5.06% of total traffic from referrals compared to 7.04% for crypto-native publishers, reflecting their self-contained traffic ecosystems where cross-publication linking and aggregator networks play minimal roles.
The most interesting divergence emerges in AI-driven discovery. Mainstream outlets capture only 0.65% of total traffic from AI referrers compared to 1.80% for crypto-native media. When measured as a share of referral traffic specifically, AI referrers account for 12.89% of mainstream referrals versus 25.61% for crypto-native outlets, which is a difference of nearly 2x.
The difference comes from varying editorial approaches and distribution incentives.
Crypto-native outlets publish narrowly scoped, highly specific content that maps cleanly to the way users prompt AI systems. Readers ask concrete questions about tokens, metrics, or short-term narratives, and AI tools respond by citing sources that address those questions directly.
Mainstream outlets write for broad audiences and emphasize narrative cohesion, institutional framing, and contextual bundling. AI systems can summarize that material without sending traffic downstream, which suppresses referral volume even when brand authority remains high.
At the same time, mainstream publishers rely on self-contained ecosystems built around direct traffic, apps, newsletters, and platform distribution, so referrals already play a limited role. Paywalls and slower update cycles further reduce AI incentives to route users outward.
The architecture of attention is shifting
US crypto-native media enters 2026, undergoing a significant transformation in how audiences discover and consume information. The Q4 data reveal an ecosystem where
- Growth and scale have diverged as success metrics. The outlets capturing the largest audiences are not necessarily those building momentum, while growth leaders often operate at a modest scale. Publishers must clarify which metric aligns with their strategic objectives.
- AI discovery has crossed from experiment to imperative. With 25.61% of referral traffic now flowing through AI intermediaries, optimization for machine comprehension represents a competitive necessity rather than an optional enhancement. Early movers in AI discoverability are capturing positioning that may prove durable as this channel continues expanding.
- Engagement quality predicts resilience. Publishers that hold attention during growth phases retain audiences during contractions. Investment in content depth, user experience, and audience relationship-building generates compounding returns that volume-first strategies cannot match.
- Platform concentration creates fragility. X's dominance of social discovery generates exceptional reach for resonant content but creates vulnerability to platform-specific disruption. Diversification across discovery channels serves as insurance against algorithmic volatility.
For publishers, growth requires either exceptional velocity to capture fleeting attention or exceptional depth to earn sustained engagement. Scale alone no longer guarantees influence. Audiences increasingly arrive through AI intermediaries that reward structure over style. The outlets that thrive will be those recognizing that discovery architecture has changed and adapting their content, format, and distribution accordingly.
Go deeper with the full dataset
This US edition represents the first comprehensive analysis of America's crypto media ecosystem in the Outset Data Pulse series.
The complete dataset covers 130 publishers with standardized metrics including total visits, unique users, session duration, pages per visit, bounce rate, traffic source composition, social platform breakdown, and AI referrer concentration. Each outlet includes CS calculations with component scores enabling granular performance analysis.
Access enables multiple use cases:
- Reproduce rankings for the full outlet set or isolate specific segments by traffic tier, primary audience, or content focus.
- Test alternative weightings on the CS formula to stress-test ranking stability.
- Compare individual publishers against category benchmarks to identify relative strengths and weaknesses.
- Monitor engagement quality and audience stability across reporting periods.
- Track shifts in AI referrer concentration as this channel continues evolving.
- Identify emerging publishers gaining momentum before they reach mainstream recognition.
- Test assumptions by redefining cohorts and re-normalizing CS outputs using the formulas detailed in the methodology.
- Build custom composite scores emphasizing metrics aligned with specific strategic objectives.
The dataset also functions as strategic intelligence for industry participants.
PR and communications teams gain clarity on where authentic exposure compounds versus where attention decays. The CS framework identifies publishers building momentum rather than merely maintaining legacy positioning.
Growth teams can identify which channels translate visibility into sustained reach. The traffic source composition data reveals discovery dynamics that inform distribution strategy beyond simple media placement.
Investors and researchers can examine the growing gap between user adoption and fragmented media economics. The divergence between scale-based and growth-based rankings illuminates competitive dynamics that raw traffic data obscures.
And lastly, publishers can observe how AI-driven discovery reshapes competitive positioning. The bimodal AI referrer distribution suggests actionable optimization opportunities for outlets currently under-indexed.
Outset PR applies this intelligence internally while maintaining open access. Industry-level transparency strengthens the ecosystem and supports better decisions across media, capital, and policy.
Check the full dataset:
As seen in: Best Known Finance, Bitzo, Bitcoin World, Block Story, blockspy, Blockphere, Blockorn, BlockNow, BitScoop, Bitcrux, BSCscoop, crypto.news, Crypto Daily, MarsBit, MPOST, TechBullion, The Blockopedia


