
We analyze audience engagement for the most visible crypto-native publishers in Q2 2025. Using Similarweb Q2 (desktop + mobile), we compare average unique visitors (for context), session duration, pages per visit, and bounce rate. Together, these signals reveal where visibility transforms into durable relationships and where it remains top-of-funnel – reinforcing a core theme of this study: scale doesn’t equal loyalty.
Methodology: what was measured and why
Purpose & scope: This data brief evaluates audience quality for outlets in tier-1 (≥400K avg. monthly) and tier-2 (130–399K avg. monthly) segments – CriptoNoticias, Cointelegraph Brasil, Bitfinanzas, Livecoins, DiarioBitcoin, Foxbit, CriptoFacil, and Portal do Bitcoin. We focus on these eight out of the full set because, together, they capture 74% of LATAM crypto-native traffic in Q2, provide more stable engagement signals than the long tail, and form a like-for-like crypto-native cohort.
Data source: We use Similarweb (desktop + mobile) so all outlets are assessed on a consistent external basis, enabling cross-site, cohort-level comparisons. The aim is to highlight relative patterns across peers, not to audit any single site.
Note: External estimates can differ from a publisher’s own analytics (e.g., GA4, Adobe, Chartbeat). Reasons include modeled vs. first-party tagging, bot/IVT filtering, cookie consent/ad block, session rules/time zones, AMP/subdomain handling, private-share classification (e.g., WhatsApp often shows as “Direct”), and web vs. app coverage. We keep the methodology consistent across outlets and focus on directional trends. When material gaps appear, we note them qualitatively rather than retro-fitting figures to individual dashboards.
Engagement signals we track:
- Visit duration (minutes per session) – depth of attention.
- Pages per visit – breadth of content consumed per session.
- Bounce rate (%) – share of single-page sessions; lower generally indicates a better intent match.
- Reach metrics – total visits and average unique visitors – are shown to contextualize scale, but they do not enter the engagement score.
Engagement Index: To make the signals comparable, we place each metric on a common 0-1 scale within this cohort (with bounce reversed so “higher = better”) and combine them into an equal weight. The Engagement Index ranks outlets relative to their peers in Q2, indicating where sessions tend to be deeper and stickier. In tie cases, we prioritize lower bounce and then higher visit duration.
CriptoNoticias – Unmatched reach; lighter session depth relative to cohort
In Q2 2025, CriptoNoticias was the only tier-1 outlet, averaging 448.38K monthly visits (1.35M total). The audience skews mobile (83%) and arrives mainly via Direct (43.4%) and Organic (47.5%), with 98% non-branded search.
On-site behavior reflects top-of-funnel discovery – 0:54 per visit, 1.57 pages, 56.60% bounce. External discovery leans on aggregators and AI (e.g., CryptoPanic, ChatGPT), with a smaller social slice across Facebook, X, LinkedIn, and Reddit.
Cointelegraph Brasil – Formidable visibility, lighter retention
Just below the 400K cutoff, Cointelegraph Brasil anchors the mid-tier at 397.04K average (1.19M total). Traffic is mobile-forward (68%) with a Direct/Organic core (39.6%/45.6%) and a higher Social share (10%) than most peers.
Engagement indicates headline-scan behavior – 0:42 per visit, 1.68 pages, 67.53% bounce – amplified by network and AI cross-feed (Cointelegraph network links plus ChatGPT/Perplexity mentions).
Bitfinanzas – Search demand captured, depth remains selective
Bitfinanzas (266.07K average/ 800.07K total) tilts to search-led discovery – very mobile (89%) and Organic-heavy (60.2%), with 99% non-branded queries.
Sessions typically satisfy a single intent: 1:24 per visit, 1.52 pages, 59.57% bounce. Referrals point to aggregators and AI (CryptoPanic, Perplexity, ChatGPT), reinforcing breadth over depth.
Livecoins – Quick answers, low friction, satisfied exits
Livecoins (223.96K average/ 670.07K total) balances Direct (43.1%) and Organic (41.9%) with a relatively high Social share (11.8%) on an 82% mobile base.
Depth is light – 0:39 and 1.48 pages – but bounce is low (35.29%), signaling strong intent match. Referrers (Terra.com.br, CryptoPanic) and diversified social (X, LinkedIn, YouTube, Instagram) support a quick-answer, multi-channel profile.
DiarioBitcoin – Newswire speed, minimal on-site exploration
DiarioBitcoin (210.25K average/ 630.74K total) leans even more into mobile (93%) and Direct-led behavior (56.4%), while search is 99% non-branded.
Engagement sits at the thinnest end of the cohort – 0:17 per visit, 1.30 pages, 50.69% bounce – consistent with alert/newswire flows and AI-summary surfaces (CryptoPanic, Meltwater, ChatGPT).
Foxbit – Workflow utility, exceptional stickiness
Foxbit (174.19K average/ 522.58K total) shows a profile oriented toward purposeful, repeat visits: desktop-weighted (57%), Direct-dominant (61.2%), and 55% branded search.
On-site behavior aligns: 6:03 per visit, 6.50 pages, 33.10% bounce. Referrals are largely utility/workflow touchpoints (CoinMarketCap, CoinTraderMonitor, Google, Linktree), with YouTube as the primary social channel – indicative of tool-like usage and deeper sessions.
CriptoFacil – Search-led fly-bys, constrained depth
CriptoFacil (172.03K average/ 516.09K total) sits between these poles: mobile 76%, Direct/Organic (40.7%/45.5%), and 87% non-branded search.
With 0:26 per visit, 1.33 pages, 65.83% bounce, behavior resembles search-led fly-bys. Referrers such as ChatGPT and CoinMarketCap, plus X/WhatsApp sharing, reinforce headline/private-share distribution rather than prolonged browsing.
Portal do Bitcoin – Discovery-heavy, retention-light
Portal do Bitcoin (134.12K average/ 403.35K total) follows a search-led pattern (Organic at 57.2% vs. Direct at 37.4%), with Referral 3.7% and Social 1.5% small in the mix. Within referrals, AI surfaces are material (36%), pointing to ChatGPT/Perplexity-style discovery alongside aggregators.
Engagement is light – 0:44 per visit, 1.53 pages, 72.69% bounce – typical of quick-resolution sessions.
%20in%20Q2%202025.png)
Engagement leader
To determine the engagement leader, we converted each engagement metric to a common 0-1 scale within this cohort (higher = better; bounce is reversed) and averaged them into one Engagement Index.
Outlets are ranked by this Index (higher = better). Tie-breakers: lower bounce, then higher visit duration. Rows are outlets; columns are normalized metrics. Brighter cells = stronger performance within this peer group.
Duration, Pages (higher = better):
Norm = ( value − min(value) ) / ( max(value) − min(value) )
(x is duration in minutes or pages/visit, respectively.)
Bounce (lower = better, inverted to “goodness”):
Norm_Bounce = 1 − ( bounce − min(bounce) ) / ( max(bounce) − min(bounce))
(x is bounce %, lower is better.)
Engagement Index (overall quality score):
Index = ( Norm_Duration + Norm_Pages + Norm_Bounce ) / 3
Duration values are converted to minutes before normalization. Normalization is within this eight-outlet cohort; adding/removing outlets will shift the 0-1 scores. The heatmap shows the three normalized metrics; the Engagement Index used for ranking is the simple average of the three normalized metrics.
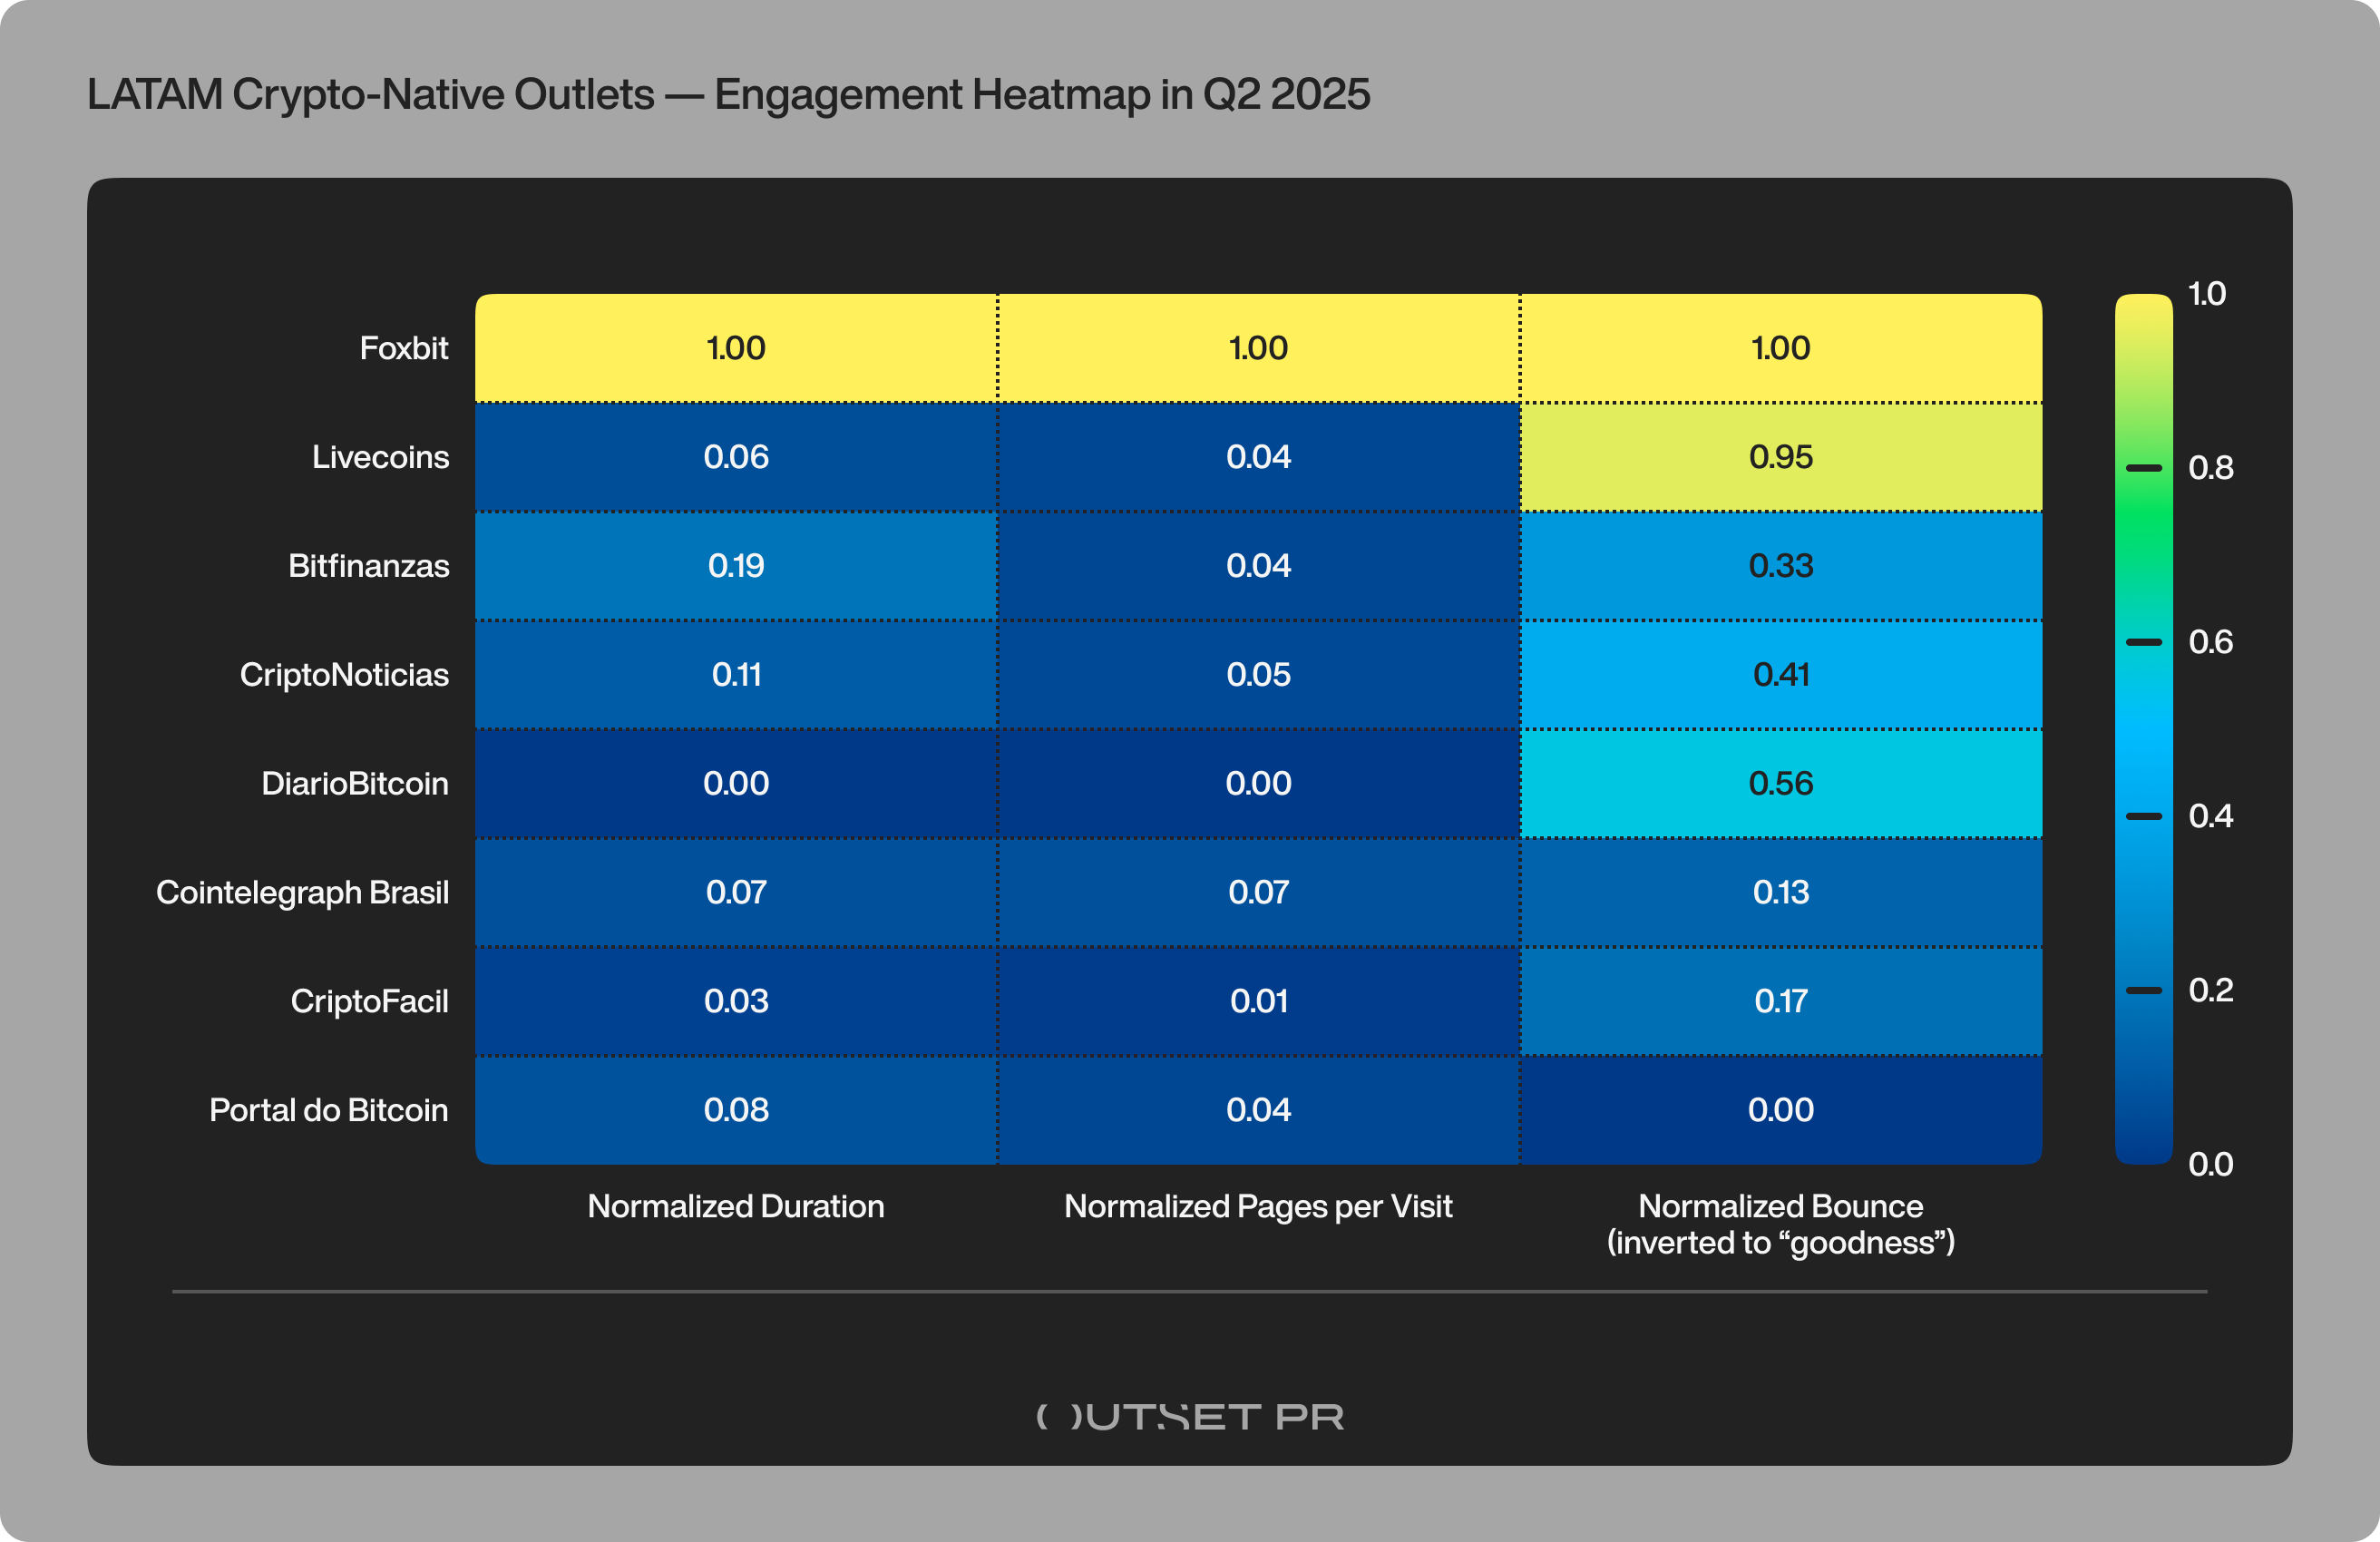
In this Q2 cohort, Foxbit ranks highest on the Engagement Index. It combines longer visits, more pages per session, and a lower bounce rate with a traffic mix that skews desktop, direct, and branded search – a pattern consistent with habitual, task-oriented use.
CriptoNoticias and Cointelegraph Brasil deliver the largest reach, concentrating attention at the top of the funnel. Livecoins shows efficient intent capture, with brief sessions and comparatively low bounce.
Overall, the results indicate that scale and loyalty do not necessarily align. High visibility can coexist with lighter per-session engagement, while smaller outlets may sustain deeper, repeat interactions.
Go deeper with the full dataset
We spotlight eight tier-1/2 outlets here, but the same Engagement Index can be applied to any of the remaining LATAM crypto-focused sites. The dataset already includes inputs for all 53 publishers – both crypto-native and mainstream outlets with crypto coverage – capturing metrics such as visits, unique users, session duration, pages per visit, and bounce rate. This allows you to:
- Replicate the rankings for the full set or any custom subset
- Track changes in engagement quality
- Test scenarios by changing the cohort and re-normalizing using the formulas in this brief
Got feedback, have input, or need consultancy? Connect with our analytics product manager Sofia: sofia@outsetpr.io


